
Profiling iOS app for memory leaks
Optimizing App Performance with Instruments
Importance of Memory Profiling in App Development
Developers always look for ways to improve their app’s performance. To achieve this, they should consistently profile their app. Instruments is a powerful performance tuning tool shipped with Xcode, providing templates to profile CPU usage, memory usage, leaks, network usage, file usage, energy consumption, and more.
Understanding Memory Leaks
Memory leaks are often overlooked when submitting apps to the App Store. They occur when memory is not properly released after being used, leading to excessive memory consumption. Over time, this can result in an out-of-memory crash, negatively affecting user experience.
While using an app, memory usage should remain stable, releasing allocated memory when no longer needed. The Leaks template in Instruments helps identify memory leaks, ensuring a more efficient app.
Steps to Perform Memory Profiling
Below are the steps to perform memory profiling on the app –
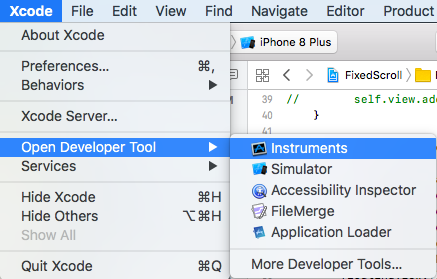
1. Select Open Developer Tools -> Instruments from the Xcode menu.
2. Select Device/Simulator and Target app on top of the template window

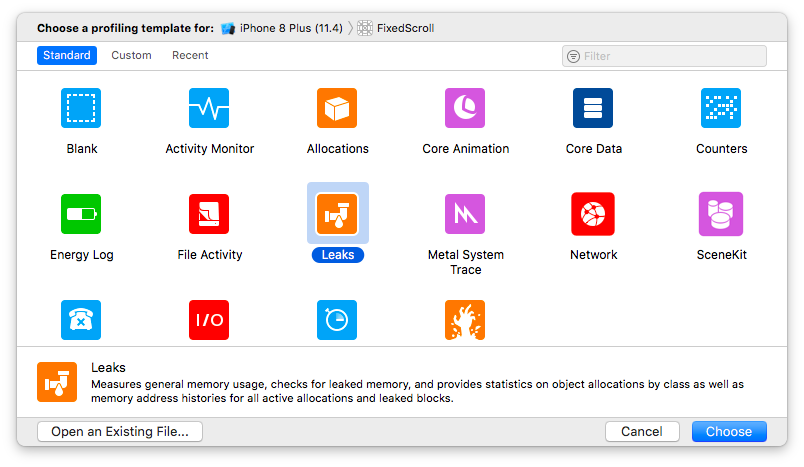
3. Select Leaks template and click Choose

This will bring the instruments window with allocation and leaks information to show
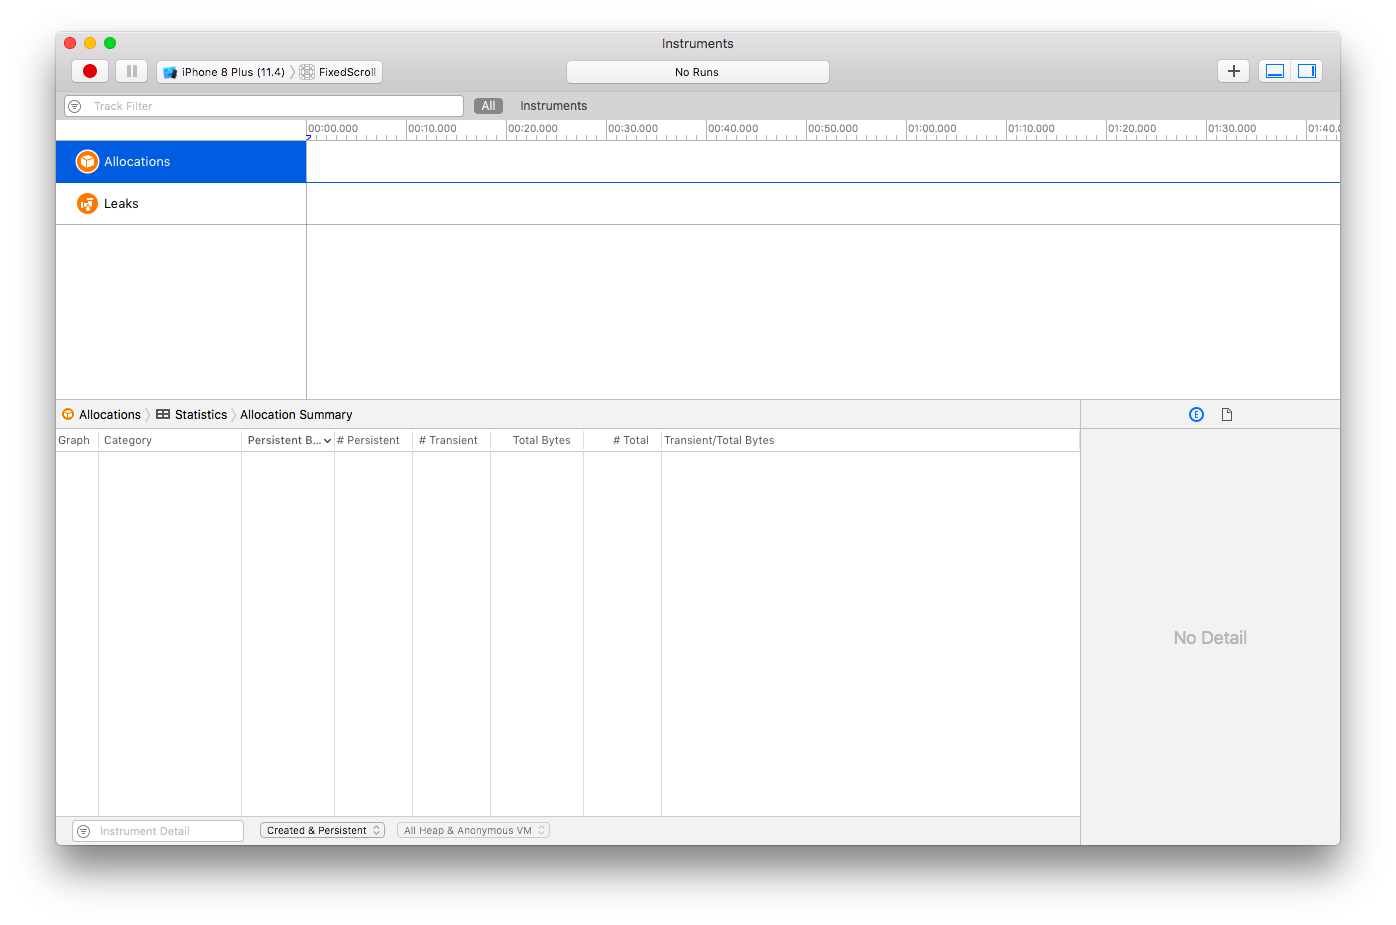
4. Select the Record button to start profiling for the app

This will start the app in the selected Device / Simulator. As you will use the app, instruments will record the allocation and leaks information about the different resources of the app.
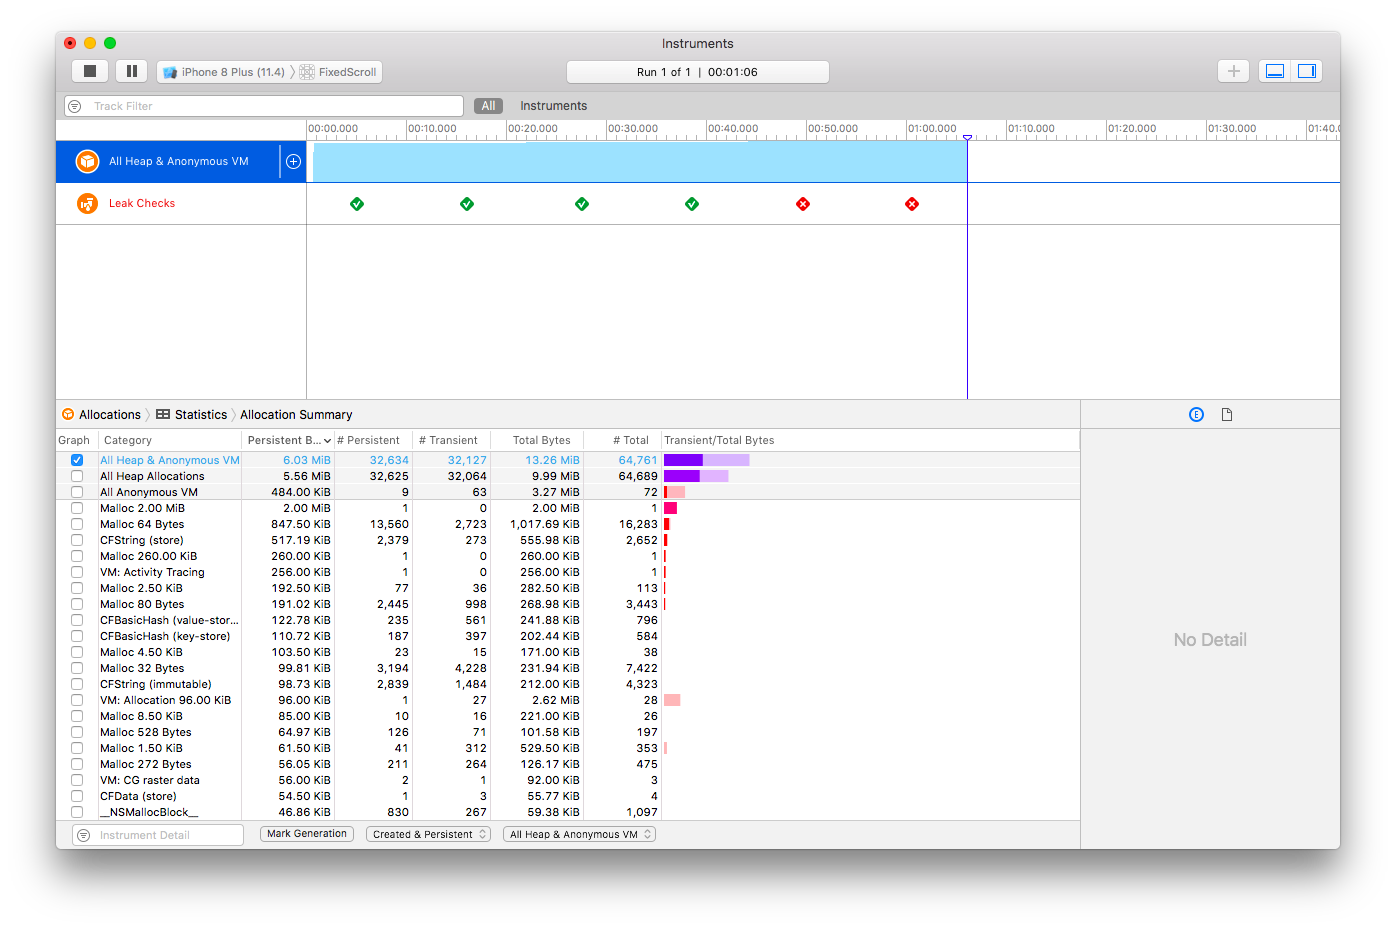
Each green check mark shows No memory leak in the app, while the user was playing around the app. And each red mark shows Memory leaks
5. Clicking on the red diamond will show the Leaks by Backtrace
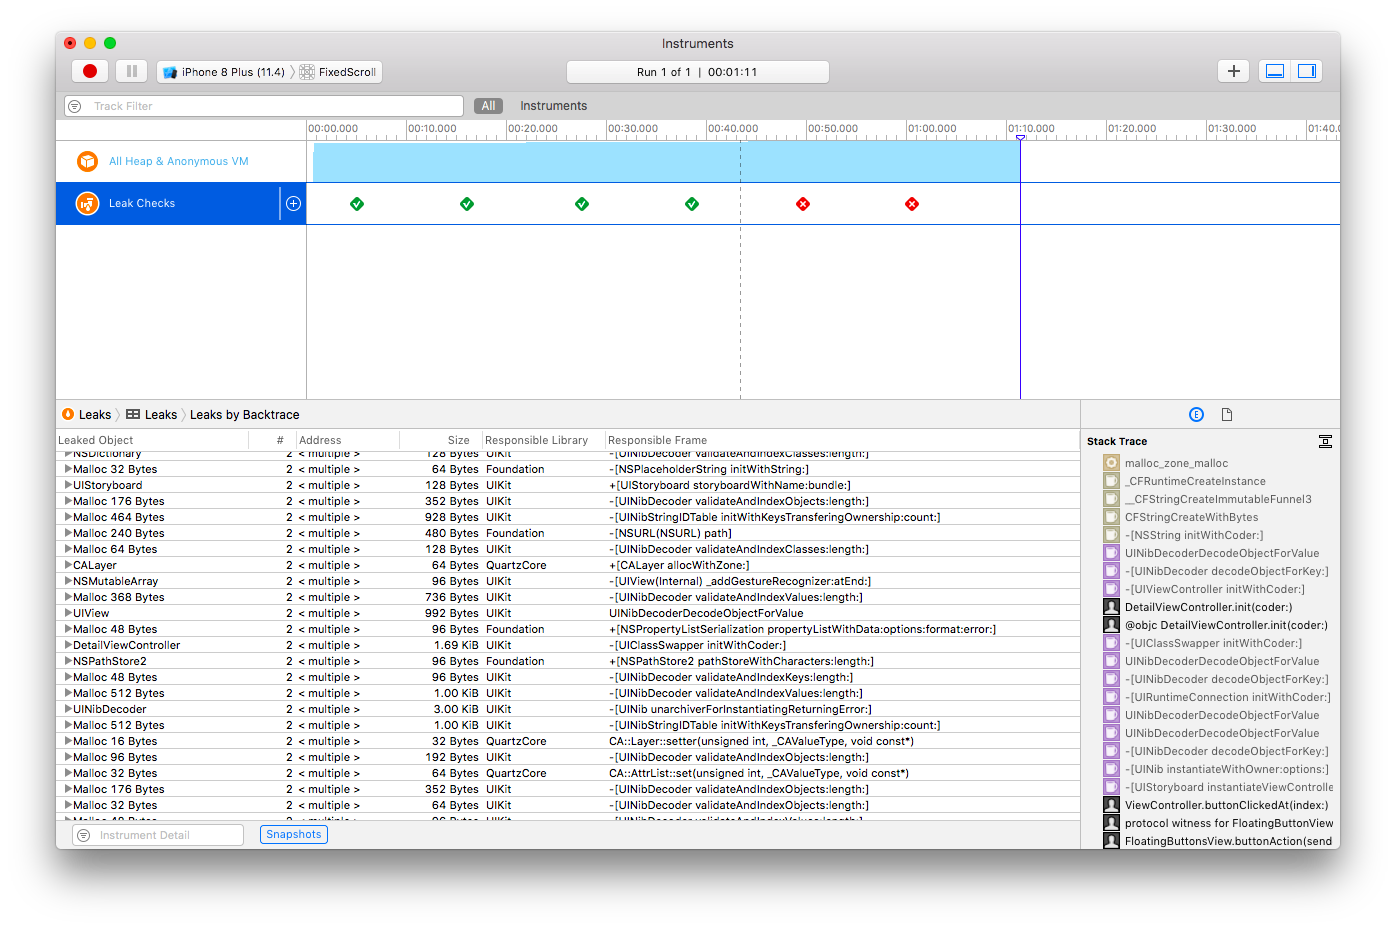
Parts in the gray color in stack trace are system libraries and parts in black color are app’s code.
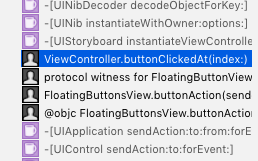
6. Double click on the black color part (App’s code) will show the code which was causing the leak
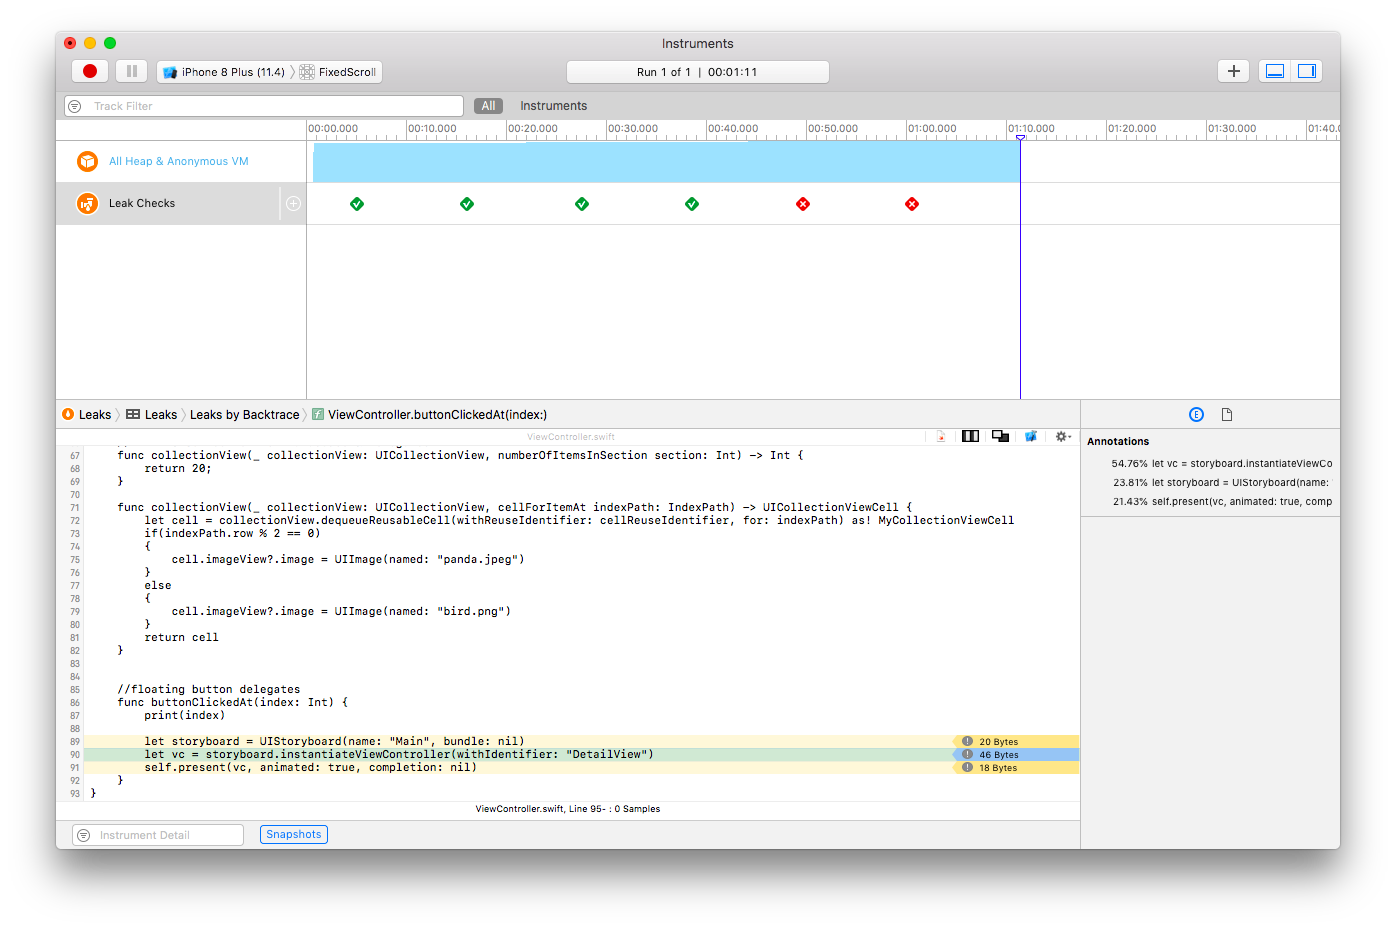
By analyzing those code snippets we can remove memory leaks and rerun profiling on the app.
How Memory Profiling Enhances Mobile App Development
Memory profiling plays a crucial role in Mobile App Development Services by ensuring better performance and stability. Identifying and fixing memory leaks prevents crashes, enhances user experience, and optimizes resource usage.
Summary
- Profiling apps for memory leaks helps detect and retain cycles and resolve them effectively.
- Memory leaks may not cause immediate issues, but as they accumulate, they can lead to app crashes.
- Using Instruments to detect and fix memory leaks improves performance, stability, and overall efficiency.
By integrating regular memory profiling into the development process, developers can create robust and high-performing apps.
Hope this blog helps. Happy Profiling! 😊

